
Geoserver+Openlayers拉框查询
2019-03-12 08:21:28来源:博客园 阅读 ()

1.代码
  1 <!DOCTYPE html>
  2 <html>
  3 <head>
  4     <meta http-equiv="Content-Type" content="text/html; charset=utf-8"/>
  5     <title>OpenLayers</title>
  6     <link rel="stylesheet" href="geoserver/ol.css" type="text/css">
  7     <script src="geoserver/ol.js"></script>
  8     <script src="bower_components/jquery/dist/jquery.min.js"></script>
  9     <link rel="stylesheet" href="plugins/layui-v2.4.3/layui/css/layui.css">
 10     <script src="plugins/layui-v2.4.3/layui/layui.js" charset="utf-8"></script>
 11     <link rel="stylesheet" href="https://openlayers.org/en/v3.20.1/css/ol.css" type="text/css">
 12     <#--注意openlayer的版本号,高版本存在es6中新语法不兼容的情况-->
 13     <script src="https://cdn.polyfill.io/v2/polyfill.min.js?features=requestAnimationFrame,Element.prototype.classList,URL"></script>
 14     <script src="https://openlayers.org/en/v3.20.1/build/ol.js"></script>
 15 </head>
 16 <style>
 17     #map {
 18         height: 600px;
 19         /*width: 1024px;*/
 20         /* float: left;*/
 21     }
 22 </style>
 23 <body>
 24 <div id="map">
 25 <form class="form-inline">
 26     <label>查询类型</label>
 27     <select id="type">
 28         <option value="None">None</option>
 29         <option value="Point">点击</option>
 30         <option value="Polygon">多边形</option>
 31         <option value="Circle">拉框</option>
 32     </select>
 33 </form>
 34 </div>
 35 <script>
 36     var map = new ol.Map({
 37         target: 'map',
 38         view: new ol.View({
 39             projection: 'EPSG:4326',
 40             center: [104.07, 30.72],
 41             zoom: 7
 42         })
 43     });
 44     var wfsParams = {
 45         service: 'WFS',
 46         version: '1.1.1',
 47         request: 'GetFeature',
 48         typeName: 'map_dz:tl_lx_g',  //图层名称,可以是单个或多个
 49         outputFormat: 'text/javascript',  //重点,不要改变
 50         format_options: 'callback:loadFeatures'  //回调函数声明
 51     };
 52
 53     var vectorSource = new ol.source.Vector({
 54         format: new ol.format.GeoJSON(),
 55         loader: function (extent, resolution, projection) {  //加载函数
 56             var url = 'http://192.168.1.113:8080/geoserver/map_dz/wms';
 57             $.ajax({
 58                 url: url,
 59                 data: $.param(wfsParams),   //传参
 60                 type: 'GET',
 61                 dataType: 'jsonp',   //解决跨域的关键
 62                 jsonpCallback: 'loadFeatures'  //回调
 63
 64             });
 65         },
 66         strategy: ol.loadingstrategy.tile(new ol.tilegrid.createXYZ({
 67             maxZoom: 20
 68         })),
 69         projection: 'EPSG:4326'
 70     });
 71     //回调函数使用
 72     window.loadFeatures = function (response) {
 73         vectorSource.addFeatures((new ol.format.GeoJSON()).readFeatures(response));  //载入要素
 74     };
 75     var vectorLayer = new ol.layer.Vector({
 76         source: vectorSource,
 77         style: new ol.style.Style({
 78             stroke: new ol.style.Stroke({
 79                 color: 'rgba(0, 0, 255, 1.0)',
 80                 width: 2
 81             })
 82         })
 83     });
 84     map.addLayer(vectorLayer);
 85     var draw;
 86     var typeSelect = document.getElementById('type');
 87     var value;
 88     var num=10;//用于删除之前的框,表示号,随便取一个
 89     function addInteraction() {
 90         if (value !== 'None') {
 91             if (value === 'Polygon') {
 92                 draw = new ol.interaction.Draw({
 93                     source: vectorLayer.getSource(),
 94                     style: new ol.style.Style({
 95                         stroke: new ol.style.Stroke({
 96                             color: '#ffcc33',
 97                             width: 2
 98                         }),
 99                         image: new ol.style.Circle({
100                             radius: 7,
101                             fill: new ol.style.Fill({
102                                 color: '#ffcc33'
103                             })
104                         })
105                     }),
106                     type: value
107                 });
108             } else if (value === 'Circle') {
109                 draw = new ol.interaction.Draw({
110                     source: vectorLayer.getSource(),
111                     style: new ol.style.Style({
112                         stroke: new ol.style.Stroke({
113                             color: '#ffcc33',
114                             width: 2
115                         }),
116                         image: new ol.style.Circle({
117                             radius: 7,
118                             fill: new ol.style.Fill({
119                                 color: '#ffcc33'
120                             })
121                         })
122                     }),
123                     type: value,
124                     geometryFunction: ol.interaction.Draw.createBox()
125                 });
126             } else if (value === 'Point') {
127                 draw = new ol.interaction.Draw({
128                     source: vectorLayer.getSource(),
129                     style: new ol.style.Style({
130                         stroke: new ol.style.Stroke({
131                             color: '#ffcc33',
132                             width: 2
133                         }),
134                         image: new ol.style.Circle({
135                             radius: 7,
136                             fill: new ol.style.Fill({
137                                 color: '#ffcc33'
138                             })
139                         })
140                     }),
141                     type: value
142                 });
143             }
144
145             map.addInteraction(draw);
146             //删除之前draw的部分
147             draw.on('drawstart',function(evt) {
148                 var featureAdd=vectorLayer.getSource().getFeatureById(num);
149                 if(featureAdd!=null){
150                     vectorLayer.getSource().removeFeature(featureAdd);
151                 }
152             });
153             //绘图结束,处理选中部分
154             draw.on('drawend',function(e){
155                 e.feature.setId(num);
156                 var geom=e.feature.getGeometry();
157                 var coor = geom.v;
158                 mapSelect(coor);
159             });
160         }
161     }
162     //选择事件
163     typeSelect.onchange = function() {
164         value = typeSelect.value;
165         map.removeInteraction(draw);
166         addInteraction();
167     };
168
169     //draw图像与原始数据相交
170     function mapSelect(coor) {
171         if(value=='Point') {
172             coor = [coor[0]-0.0001,coor[1]-0.0001,coor[0]+0.0001,coor[1]+0.0001];
173         }
174         var FILTER = '<Filter xmlns:ogc="http://www.opengis.net/ogc" xmlns:gml="http://www.opengis.net/gml"><BBOX><PropertyName>geom</PropertyName><gml:Envelope srsName="EPSG:4326"><gml:lowerCorner>' + coor[0] + '  ' + coor[1] + '</gml:lowerCorner><gml:upperCorner>' + coor[2] + '  ' + coor[3] + '</gml:upperCorner></gml:Envelope></BBOX></Filter>';
175         getFeature({
176             typename: 'map_dz:tl_lx_g',//查询的服务图层名称
177             filter: FILTER,//查询条件
178             callback: 'getIdentifyroadGrid'//查询的回调函数
179         });
180     }
181     var selectNum=[];
182     var geojsonFormat = new ol.format.GeoJSON({defaultDataProjection: "EPSG:4326"});
183     function getIdentifyroadGrid(res) {
184         var queryData = [];
185         var features = geojsonFormat.readFeatures(res);
186
187        for (var nu = 0; nu<selectNum.length;nu++) {
188             var featureSelect=vectorLayer.getSource().getFeatureById(selectNum[nu]);
189             if(featureSelect!=null) {
190                 featureSelect.setStyle(
191                         new ol.style.Style({
192                             stroke: new ol.style.Stroke({
193                                 color: 'rgba(0, 0, 255, 1.0)',
194                                 width: 2
195                             })
196                         }));
197             }
198         }
199         selectNum=[];
200         for (var i = 0; i < features.length; i++) {
201             var feature = features[i];
202             console.log(feature);
203             selectNum.push(feature.f);
204             var featureSelectCurrent=vectorLayer.getSource().getFeatureById(feature.f);
205             featureSelectCurrent.setStyle(
206                     new ol.style.Style({
207                         stroke: new ol.style.Stroke({
208                             color: '#ff4118',
209                             width: 2
210                         })
211                     }));
212             var lxmc = feature.H["lxmc"];
213             var ldbm = feature.H["ldbm"];
214             var lxbh = feature.H["lxbh"];
215             var result = {
216                 "lxmc": lxmc,
217                 "ldbm": ldbm,
218                 "lxbh": lxbh,
219                 "setindex": i
220             };
221             queryData.push(result)
222         }
223         console.log(selectNum);
224         var tableIns=null;
225         var dataTable = "<table class=\"layui-table\" lay-filter=\"demo\" id=\"joinTab\"></table>";
226         layui.use(['table', 'layer'], function () {
227             var table = layui.table;
228             var layer = layui.layer;
229             var index = layer.open({
230                 type: 1 //Page层类型
231                 , title: '要素属性'
232                 , shade: 0 //遮罩透明度
233                 , anim: 0 //0-6的动画形式,-1不开启
234                 , content: dataTable
235                 , offset: ['250px', '290px']
236                 , zIndex: 1
237                 , scrollbar: false
238                 , resize: false
239                 , skin: 'layui-layer-molv'
240                 , closeBtn: 2
241                 , btn: ["关闭"]
242                 , yes: function (index) {
243                     layer.close(index);
244                 }
245                 , cancel: function () {
246                 }
247             });
248             tableIns = table.render({
249                 elem: "#joinTab",
250                 width: "auto",
251                 height: "auto",
252                 data: queryData,
253                 initSort: {field: 'lxbh', type: 'desc'},
254                 cols: [[
255                     {field: 'lxmc', title: '路线名称', width: 150, align: 'center', sort: true},
256                     {field: 'ldbm', title: '路线编号', width: 150, align: 'center', sort: true},
257                     {field: 'lxbh', title: '路段编码', width: 150, align: 'center', sort: true}
258                 ]]
259             });
260             layer.style(index, {
261                 opacity: 0.8
262             });
263         });
264
265         if (tableIns) {
266             tableIns.reload({
267                 data: queryData
268             });
269         } else {
270             // console.log("Do Nothing!");
271         }
272     }
273
274     //请求wfs数据
275     function getFeature(options) {
276         $.ajax(/*'http://192.168.1.113:8080/geoserver/map_dz/wms', */{
277             type: 'GET',
278             url: 'http://192.168.1.113:8080/geoserver/map_dz/wms',
279             data: {
280                 service: 'WFS',
281                 version: '1.1.1',
282                 request: 'GetFeature',
283                 typename: options.typename,
284                 srsname: options.srid,
285                 outputFormat: 'text/javascript',
286                 viewparams: options.viewparams,
287                 bbox: (options.extent === undefined) ? undefined : options.extent.join(',') + ',' + options.srid,
288                 filter: options.filter
289             },
290             dataType: 'jsonp',
291             jsonp: 'format_options',
292             jsonpCallback: 'callback:' + options.callback
293         });
294
295     }
296
297 </script>
298 </body>
299 </html>
2.代码解释
这一部分是主要针对用户做此功能的时候,遇到的问题进行总结:
在引入 Openlayers 的 JS 文件的时候,注意版本号,5.0+ 的版本中大量应用了ES6 的最新特性,如果直接引入 5.0+ ,可能与前期的项目有所冲突,所以这里建议使用低版本,同样能完成拉框查询

这里主要通过 Draw 对象进行框选的,Draw 的本质是在图层上兴建 Shape ,那么在下一次框选的时候,需要把上次 Draw 的框去掉:(回答了网上用户的提问:openlayers 在重新画图(圆或矩形)如何清除之前的图,Openlayer删除上一次绘制的图)
首先记录框选时,增加的框框的ID
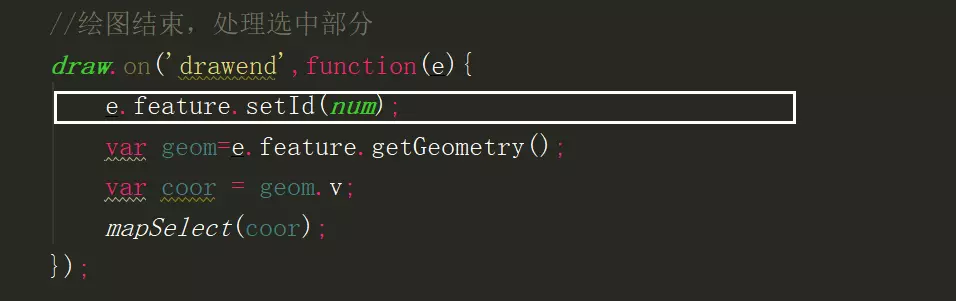 然后在下次框选之前,通过 id 找到上次那个 Feature,并删掉
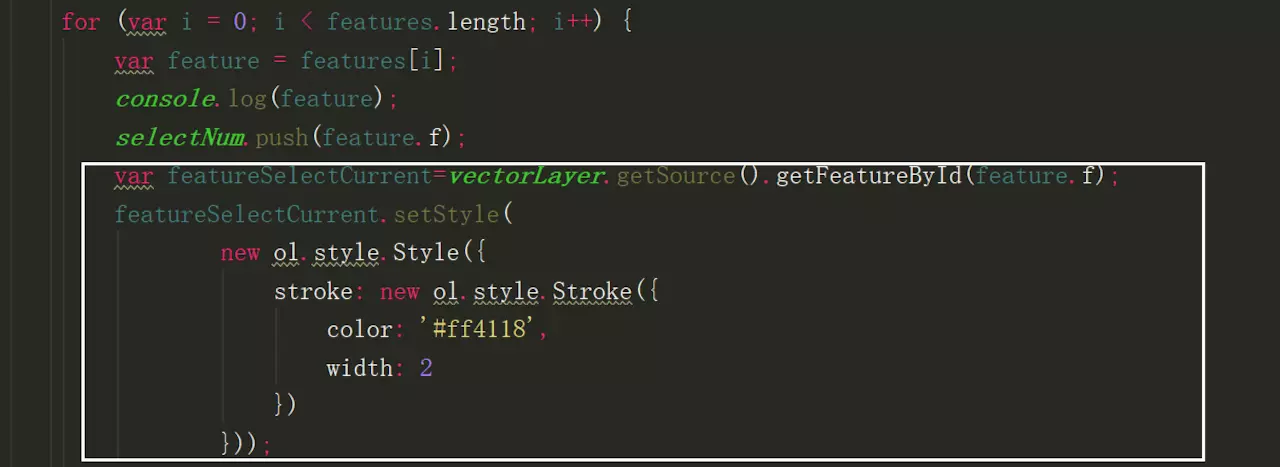
对选中的对象进行重新设置颜色,这里主要通过 Style 属性进行处理:
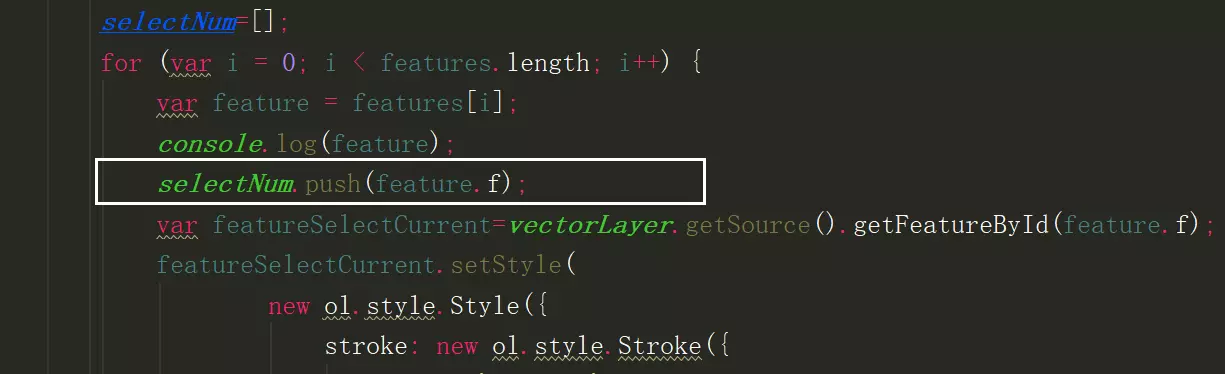
在下次选中对象的时候,删除上次选中对象的样式 将选中对象的 id 压到数组汇总
在下次设置选中对象的样式之前,遍历数组,对上次选中的feature进行样式设置(设置为原来的样式)

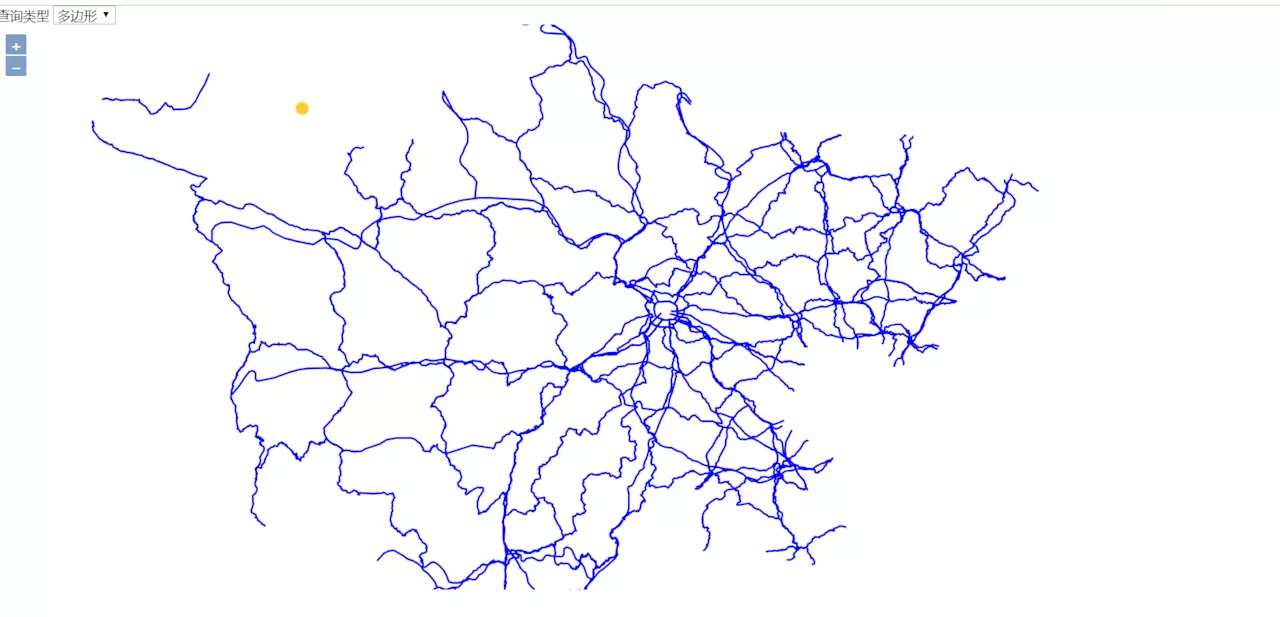
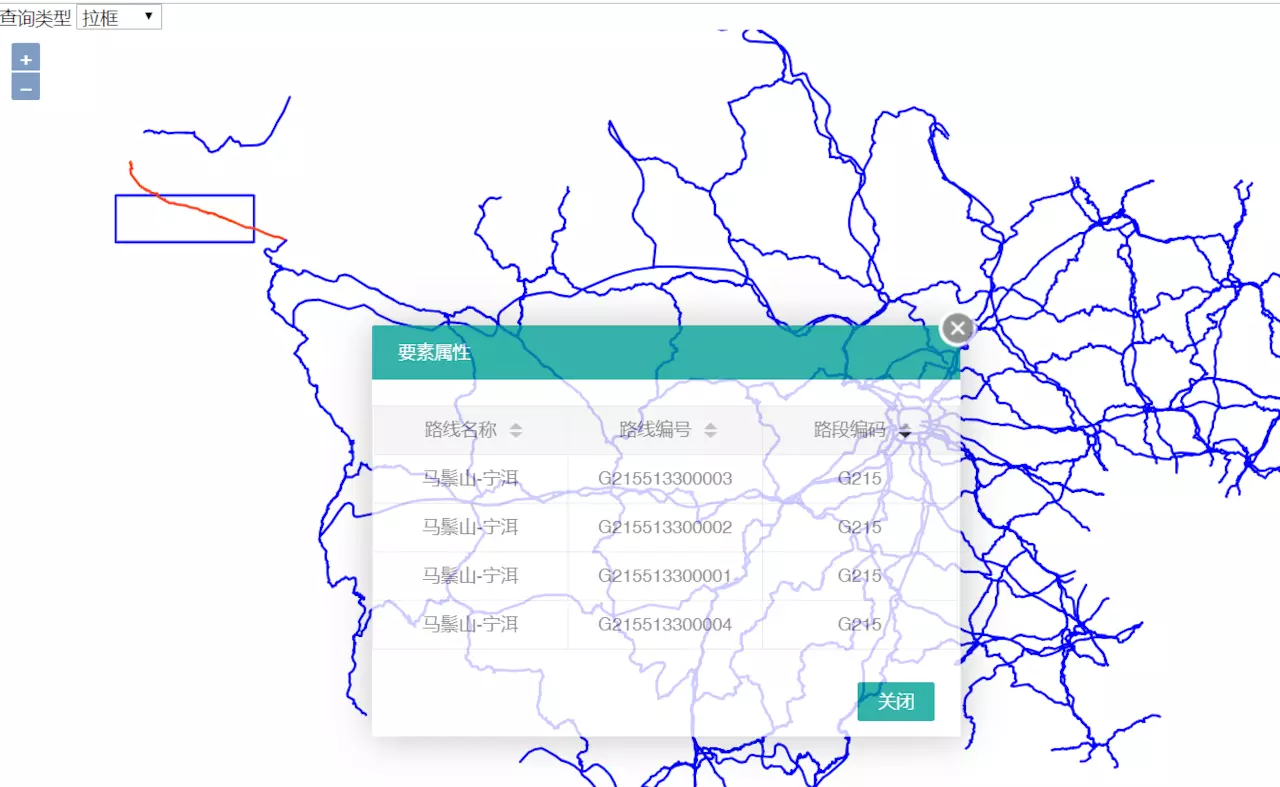
3.结果

参考
https://www.cnblogs.com/kkyyhh96/p/6379515.html
https://blog.csdn.net/songjian1314/article/details/17263865
https://blog.csdn.net/shaxiaozilove/article/details/60780175
https://blog.csdn.net/m0_37659871/article/details/80598589
https://openlayers.org/en/latest/examples/draw-features.html
https://openlayers.org/en/latest/examples/draw-shapes.html
原文链接:https://www.cnblogs.com/dz-boss/p/10516963.html
如有疑问请与原作者联系
标签:
版权申明:本站文章部分自网络,如有侵权,请联系:west999com@outlook.com
特别注意:本站所有转载文章言论不代表本站观点,本站所提供的摄影照片,插画,设计作品,如需使用,请与原作者联系,版权归原作者所有

上一篇:深入剖析z-index属性
下一篇:1111
- 循序渐进VUE+Element 前端应用开发(5)--- 表格列表页面的查 2020-07-15
- 循序渐进VUE+Element 前端应用开发(5)--- 表格列表页面的查 2020-07-15
- 循序渐进VUE+Element 前端应用开发(5)--- 表格列表页面的查 2020-07-14
- 循序渐进VUE+Element 前端应用开发(5)--- 表格列表页面的查 2020-07-13
- 循序渐进VUE+Element 前端应用开发(5)--- 表格列表页面的查 2020-07-02
IDC资讯: 主机资讯 注册资讯 托管资讯 vps资讯 网站建设
网站运营: 建站经验 策划盈利 搜索优化 网站推广 免费资源
网络编程: Asp.Net编程 Asp编程 Php编程 Xml编程 Access Mssql Mysql 其它
服务器技术: Web服务器 Ftp服务器 Mail服务器 Dns服务器 安全防护
软件技巧: 其它软件 Word Excel Powerpoint Ghost Vista QQ空间 QQ FlashGet 迅雷
网页制作: FrontPages Dreamweaver Javascript css photoshop fireworks Flash
